Aflatoxin B2CAS# 7220-81-7 |

Quality Control & MSDS
3D structure
Package In Stock

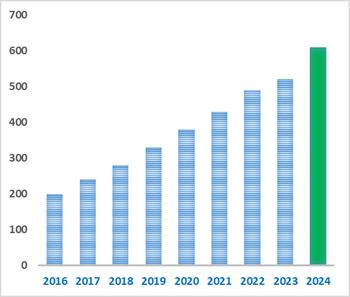
Number of papers citing our products
| Cas No. | 7220-81-7 | SDF | Download SDF |
| PubChem ID | 2724360 | Appearance | Powder |
| Formula | C17H14O6 | M.Wt | 314.3 |
| Type of Compound | N/A | Storage | Desiccate at -20°C |
| Solubility | Soluble in Chloroform,Dichloromethane,Ethyl Acetate,DMSO,Acetone,etc. | ||
| SMILES | COC1=C2C3=C(C(=O)CC3)C(=O)OC2=C4C5CCOC5OC4=C1 | ||
| Standard InChIKey | WWSYXEZEXMQWHT-WNWIJWBNSA-N | ||
| Standard InChI | InChI=1S/C17H14O6/c1-20-10-6-11-14(8-4-5-21-17(8)22-11)15-13(10)7-2-3-9(18)12(7)16(19)23-15/h6,8,17H,2-5H2,1H3/t8-,17+/m0/s1 | ||
| General tips | For obtaining a higher solubility , please warm the tube at 37 ℃ and shake it in the ultrasonic bath for a while.Stock solution can be stored below -20℃ for several months. We recommend that you prepare and use the solution on the same day. However, if the test schedule requires, the stock solutions can be prepared in advance, and the stock solution must be sealed and stored below -20℃. In general, the stock solution can be kept for several months. Before use, we recommend that you leave the vial at room temperature for at least an hour before opening it. |
||
| About Packaging | 1. The packaging of the product may be reversed during transportation, cause the high purity compounds to adhere to the neck or cap of the vial.Take the vail out of its packaging and shake gently until the compounds fall to the bottom of the vial. 2. For liquid products, please centrifuge at 500xg to gather the liquid to the bottom of the vial. 3. Try to avoid loss or contamination during the experiment. |
||
| Shipping Condition | Packaging according to customer requirements(5mg, 10mg, 20mg and more). Ship via FedEx, DHL, UPS, EMS or other couriers with RT, or blue ice upon request. | ||

Aflatoxin B2 Dilution Calculator
Aflatoxin B2 Molarity Calculator
| 1 mg | 5 mg | 10 mg | 20 mg | 25 mg | |
| 1 mM | 3.1817 mL | 15.9084 mL | 31.8167 mL | 63.6335 mL | 79.5418 mL |
| 5 mM | 0.6363 mL | 3.1817 mL | 6.3633 mL | 12.7267 mL | 15.9084 mL |
| 10 mM | 0.3182 mL | 1.5908 mL | 3.1817 mL | 6.3633 mL | 7.9542 mL |
| 50 mM | 0.0636 mL | 0.3182 mL | 0.6363 mL | 1.2727 mL | 1.5908 mL |
| 100 mM | 0.0318 mL | 0.1591 mL | 0.3182 mL | 0.6363 mL | 0.7954 mL |
| * Note: If you are in the process of experiment, it's necessary to make the dilution ratios of the samples. The dilution data above is only for reference. Normally, it's can get a better solubility within lower of Concentrations. | |||||

Calcutta University

University of Minnesota

University of Maryland School of Medicine

University of Illinois at Chicago

The Ohio State University

University of Zurich

Harvard University

Colorado State University

Auburn University

Yale University

Worcester Polytechnic Institute

Washington State University

Stanford University

University of Leipzig

Universidade da Beira Interior

The Institute of Cancer Research

Heidelberg University

University of Amsterdam

University of Auckland

TsingHua University

The University of Michigan

Miami University

DRURY University

Jilin University

Fudan University

Wuhan University

Sun Yat-sen University

Universite de Paris

Deemed University

Auckland University

The University of Tokyo

Korea University
- 2-Hydroxyplatyphyllide
Catalog No.:BCN7119
CAS No.:72145-19-8
- b-Casomorphin (1-3)
Catalog No.:BCC1007
CAS No.:72122-59-9
- Nerolidol
Catalog No.:BCN5459
CAS No.:7212-44-4
- Prilocaine
Catalog No.:BCC4929
CAS No.:721-50-6
- Mastoparan X
Catalog No.:BCC5833
CAS No.:72093-22-2
- 5(6)-Carboxyfluorescein
Catalog No.:BCC8283
CAS No.:72088-94-9
- 6,2',4'-Trimethoxyflavone
Catalog No.:BCC3897
CAS No.:720675-74-1
- Spinosin
Catalog No.:BCN1644
CAS No.:72063-39-9
- Sepinol
Catalog No.:BCN4277
CAS No.:72061-63-3
- Lochnericine
Catalog No.:BCN4595
CAS No.:72058-36-7
- NHS-LC-Biotin
Catalog No.:BCC3579
CAS No.:72040-63-2
- Henryoside
Catalog No.:BCN4276
CAS No.:72021-23-9
- Calcitetrol
Catalog No.:BCC1446
CAS No.:72203-93-1
- Parsonsine
Catalog No.:BCN2111
CAS No.:72213-98-0
- Echitovenidine
Catalog No.:BCN7482
CAS No.:7222-35-7
- 2-Hydroxyeupatolide
Catalog No.:BCN2490
CAS No.:72229-33-5
- 2alpha-Hydroxyeupatolide 8-O-angelate
Catalog No.:BCN7340
CAS No.:72229-39-1
- Laurifoline
Catalog No.:BCN4278
CAS No.:7224-61-5
- Org 24598 lithium salt
Catalog No.:BCC7845
CAS No.:722456-08-8
- AZD1152
Catalog No.:BCC1393
CAS No.:722543-31-9
- Barasertib (AZD1152-HQPA)
Catalog No.:BCC2168
CAS No.:722544-51-6
- Malvidin-3-O-glucoside chloride
Catalog No.:BCN3031
CAS No.:7228-78-6
- Streptolydigin
Catalog No.:BCN1858
CAS No.:7229-50-7
- Sulfamethoxazole
Catalog No.:BCC4857
CAS No.:723-46-6
Occurrence of Aflatoxin and Aflatoxigenic Molds in Foods and Feed in Spain.[Pubmed:30959662]
J Food Prot. 1986 Jun;49(6):445-448.
A survey was carried out to obtain data on the occurrence of aflatoxin and aflatoxigenic mold contamination of foods in Spain. A variety of commodities amounting to 338 samples were analyzed, comprising cereal grains, mixed feeds, edible nuts, wheat flour for bread-making, biscuits, sliced bread, soya beans and breakfast cereals. The results reveal a rather low incidence of aflatoxin contamination in samples tested. Aflatoxins were detected in 4 of 27 samples of mixed feeds at levels below 5 mug/kg; one sample of peanuts was contaminated with 120 mug aflatoxin B1/kg and 22 mug Aflatoxin B2/kg. Aflatoxins B1 and B2 were also detected in a lot of whole maize flour, averaging 8 mug/kg and 3 mug/kg, respectively. Of a total of 288 samples tested, 100% showed variable incidences of fungal contamination. Maize samples were the ones most frequently contaminated with Aspergillus flavus (54.5%). Strains of A. flavus isolated from maize samples also showed the highest proportion of aflatoxigenic molds (17.2%) compared with those isolated from other sources.
Identification of genomic regions and diagnostic markers for resistance to aflatoxin contamination in peanut (Arachis hypogaea L.).[Pubmed:30866805]
BMC Genet. 2019 Mar 12;20(1):32.
BACKGROUND: Aflatoxin contamination caused by Aspergillus flavus is a major constraint to peanut industry worldwide due to its toxicological effects to human and animals. Developing peanut varieties with resistance to seed infection and/or aflatoxin accumulation is the most effective and economic strategy for reducing aflatoxin risk in food chain. Breeding for resistance to aflatoxin in peanut is a challenging task for breeders because the genetic basis is still poorly understood. To identify the quantitative trait loci (QTLs) for resistance to aflatoxin contamination in peanut, a recombinant inbred line (RIL) population was developed from crossing Zhonghua 10 (susceptible) with ICG 12625 (resistant). The percent seed infection index (PSII), the contents of aflatoxin B1 (AFB1) and Aflatoxin B2 (AFB2) of RILs were evaluated by a laboratory kernel inoculation assay. RESULTS: Two QTLs were identified for PSII including one major QTL with 11.32-13.00% phenotypic variance explained (PVE). A total of 12 QTLs for aflatoxin accumulation were detected by unconditional analysis, and four of them (qAFB1A07 and qAFB1B06.1 for AFB1, qAFB2A07 and qAFB2B06 for AFB2) exhibited major and stable effects across multiple environments with 9.32-21.02% PVE. Furthermore, not only qAFB1A07 and qAFB2A07 were co-localized in the same genetic interval on LG A07, but qAFB1B06.1 was also co-localized with qAFB2B06 on LG B06. Conditional QTL mapping also confirmed that there was a strong interaction between resistance to AFB1 and AFB2 accumulation. Genotyping of RILs revealed that qAFB1A07 and qAFB1B06.1 interacted additively to improve the resistance to both AFB1 and AFB2 accumulation. Additionally, validation of the two markers was performed in diversified germplasm collection and four accessions with resistance to aflatoxin accumulation were identified. CONCLUSIONS: Single major QTL for resistance to PSII and two important co-localized intervals associated with major QTLs for resistance to AFB1 and AFB2. Combination of these intervals could improve the resistance to aflatoxin accumulation in peanut. SSR markers linked to these intervals were identified and validated. The identified QTLs and associated markers exhibit potential to be applied in improvement of resistance to aflatoxin contamination.
Assessing Aflatoxin Exposure Risk from Peanuts and Peanut Products Imported to Taiwan.[Pubmed:30717134]
Toxins (Basel). 2019 Feb 1;11(2). pii: toxins11020080.
Aflatoxins are highly toxic and cause disease in livestock and humans. In order to assess Taiwan population exposure to aflatoxin from peanuts and peanut products, a total of 1089 samples of peanut candy, peanut butter, and peanuts etc. were collected in the period from 2011 to 2017 and analyzed using a liquid chromatography/tandem mass spectrometer. The overall mean contamination levels of aflatoxin in peanuts and peanut products were 2.40 mug/kg of aflatoxin B1, 0.41 mug/kg of Aflatoxin B2, 0.19 mug/kg of aflatoxin G1, and 0.03 mug/kg of aflatoxin G2. We use margin of exposure (MOE) as a tool to improve food safety management. According to MOE levels of aflatoxins in peanuts and peanut products from China, Indonesia, Thailand, the United States, and the Philippines were above the safe lower limit of 10,000, indicating an absence of public health or safety risk for the majority of the population. However, products from Vietnam were under the MOE safe lower limit, suggesting that regulatory actions must be continued to avoid excessive consumer exposure.
Monitoring Metabolite Production of Aflatoxin Biosynthesis by Orbitrap Fusion Mass Spectrometry and a D-Optimal Mixture Design Method.[Pubmed:30444348]
Anal Chem. 2018 Dec 18;90(24):14331-14338.
Aflatoxins, highly toxic and carcinogenic to humans, are synthesized via multiple intermediates by a complex pathway in several Aspergilli, including Aspergillus flavus. Few analytical methods are available for monitoring the changes in metabolite profiles of the aflatoxin biosynthesis pathway under different growth and environmental conditions. In the present study, we developed by a D-optimal mixture design a solvent system, methanol/dichloromethane/ethyl acetate/formic acid (0.36/0.31/0.32/0.01), that was suitable for extracting the pathway metabolites. The matrix effect from dilution of cell extracts was negligible. To facilitate the identification of these metabolites, we constructed a fragmentation ion library. We further employed liquid chromatography coupled with high-resolution mass spectroscopy (UHPLC-HRMS) for simultaneous quantification of the metabolites. The limit of detection (LOD) and limit of quantitation (LOQ) were 0.002-0.016 and 0.008-0.05 mug/kg, respectively. The spiked recovery rates ranged from 81.3 to 100.3% with intraday and interday precision less than 7.6%. Using the method developed to investigate the time-course aflatoxin biosynthesis, we found that precursors, including several possible toxins (with a carcinogenic group similar to aflatoxin B1), occurred together with aflatoxin, and that production increased rapidly at the early growth stage, peaked on day four, and then decreased substantially. The maximum production of aflatoxin B1 and Aflatoxin B2 occurred 1 day later. Moreover, the dominant branch pathway was the one for aflatoxin B1 formation. We revealed that the antiaflatoxigenicity mechanism of Leclercia adecarboxylata WT16 was associated with a factor upstream of the aflatoxin biosynthesis pathway. The design strategies can be applied to characterize or detect other secondary metabolites to provide a snapshot of the dynamic changes during their biosynthesis.
Occurrence of multi-class mycotoxins in Menthae haplocalycis analyzed by ultra-fast liquid chromatography coupled with tandem mass spectrometry.[Pubmed:30168664]
J Sep Sci. 2018 Nov;41(21):3974-3984.
To determine the presence of multi-class mycotoxins in Menthae haplocalycis, a sample processing procedure based on a modified quick, easy, effective, rugged, and safe method, and a rapid and accurate testing method using ultra-fast performance liquid chromatography coupled with tandem mass spectrometry, was developed and validated. We systematically evaluated the methodology for multi-mycotoxin analysis in the Menthae haplocalycis samples, and chose matrix-matched calibration curves as a reference to calculate the recoveries. Overall, the average recoveries varied between 67.1 and 103%, with relative standard deviations ranging from 0.34 to 10.3%. The optimized and validated method was applied to detect the presence of the target mycotoxins in 40 batches of Menthae haplocalycis samples. Results showed that the levels of mycotoxins varied among the samples. The most prevalent mycotoxin was tentoxin, followed by alternariol, alternariol monomethyl ether, zearalenone, fumonisin B2 , fumonisin B1 , ochratoxin A, aflatoxin B1 , Aflatoxin B2 , aflatoxin G1 , and T-2 toxin. The analytical method developed herein could be applied for the routine monitoring of multi-mycotoxins in Menthae haplocalycis.
Effect of aflatoxin B1, benzo[a]pyrene, and methapyrilene on transcriptomic and epigenetic alterations in human liver HepaRG cells.[Pubmed:30157460]
Food Chem Toxicol. 2018 Nov;121:214-223.
The increasing number of man-made chemicals in the environment that may pose a carcinogenic risk highlights the need for developing reliable time- and cost-effective approaches for carcinogen detection and identification. To address this issue, we investigated the utility of high-throughput microarray gene expression and next-generation genome-wide DNA methylation sequencing for the in vitro identification of genotoxic and non-genotoxic carcinogens. Terminally differentiated and metabolically competent human liver HepaRG cells were treated at minimally cytotoxic concentrations of (i) the genotoxic human liver carcinogen aflatoxin B1 (AFB1) and its structural non-carcinogenic analog Aflatoxin B2 (AFB2); (ii) the genotoxic human lung carcinogen benzo[a]pyrene (B[a]P) and its non-carcinogenic isomer benzo[e]pyrene (B[e]P); and (iii) the non-genotoxic liver carcinogen methapyrilene for 72h and transcriptomic and DNA methylation profiles were examined. Treatment of HepaRG cells with the liver carcinogens AFB1 and methapyrilene generated distinct gene-expression profiles, whereas B[a]P had only a slight effect on gene expression. In contrast to transcriptomic alterations, treatment of HepaRG cells with the carcinogenic and non-carcinogenic chemicals resulted in profound changes in the DNA methylation footprint; however, the correlation between gene-specific DNA methylation and gene expression changes was minimal. Among the carcinogen-altered genes, transferrin (TF) emerged as sensitive marker for an initial screening of chemicals for their potential liver carcinogenicity. Potential liver carcinogens (i.e., chemicals causing altered TF gene expression) could then be subjected to gene-expression analyses to differentiate genotoxic from non-genotoxic liver carcinogens. This approach may substantially enhance the identification and assessment of potential liver carcinogens.
A miniaturized solid-phase extraction adsorbent of calix[4]arene-functionalized graphene oxide/polydopamine-coated cellulose acetate for the analysis of aflatoxins in corn.[Pubmed:30098128]
J Sep Sci. 2018 Oct;41(20):3892-3901.
A calix[4]arene-functionalized graphene oxide/polydopamine-coated cellulose acetate adsorbent was fabricated for the pre-concentration of aflatoxins. The highly porous developed adsorbent does not produce the high backpressure that normally occurs in particle-packed cartridges and its large surface area helps to improve adsorption. The highly efficient adsorption of aflatoxins by the hybrid adsorbent is facilitated via hydrogen bonding and hydrophobic and pi-pi interactions. Polymerization time, amount of calix[4]arene-functionalized graphene oxide, type and volume of desorption solvent, sample pH, sample volume, and sample flow rate were optimized. The linearity of aflatoxin B1 was in the range of 0.01-10.0 mug/kg, Aflatoxin B2 was in the range of 0.02-10.0 mug/kg and aflatoxin G1 and aflatoxin G2 were in the range of 0.050-10.0 mug/kg. The limits of detection were 0.01 mug/kg for aflatoxin B1, 0.02 mug/kg for Aflatoxin B2 and 0.05 mug/kg for aflatoxin G1 and aflatoxin G2. The developed calix[4]arene-functionalized graphene oxide/polydopamine-coated cellulose acetate adsorbent was successfully utilized for the analysis of aflatoxins from corn samples and the extraction efficiency was satisfactory with obtained recoveries from 83.0 to 106.7%. Moreover, fabricated adsorbent is easy to prepare, inexpensive, and can be reused.
Direct fluorescence anisotropy approach for aflatoxin B1 detection and affinity binding study by using single tetramethylrhodamine labeled aptamer.[Pubmed:30086944]
Talanta. 2018 Nov 1;189:442-450.
The discovery of aptamers for aflatoxin B1 (AFB1), one of toxic carcinogens, has allowed to develop aptamer-based sensors and assays for aflatoxin. In this work, we reported a direct fluorescence anisotropy (FA) assay for investigation of aptamer-AFB1 binding and detection of AFB1 with the aptamer having single tetramethylrhodamine (TMR) label on a specific site. From a series of labeling sites of a 50-mer aptamer, we screened out the aptamer with TMR labeling at the 26th T, capable of generating good and large FA-decreasing response to AFB1. By using the T26-labeled 50-mer aptamer probe in FA analysis, we determined the affinity and selectivity of aptamer, and identified the crucial region of aptamer and optimum experimental conditions for strong binding. The aptamer could be further truncated to as short as 26 nucleotides in length, and this shorter aptamer possessed a simple stem-loop secondary structure and retained good binding affinity. Nucleotides in the loop region of the aptamer were conserved and important for affinity recognition. We achieved FA detection of AFB1 with a detection limit about 2nM by using the TMR-labeled aptamer probe. The cross reactivity of aflatoxin B1, Aflatoxin B2, aflatoxin M1, aflatoxin M2, aflatoxin G1, and aflatoxin G2 with aptamer were estimated to be 100%, 61%, 23%, 21%, 6.3%, 6.5%, respectively. The aptamer probe presented good selectivity over other mycotoxins and showed potential in complex sample analysis. This study of affinity binding between aptamer and aflatoxins will be helpful for developing other aptamer-based assays and sensors for aflatoxins.
Simultaneous Analysis of 20 Mycotoxins in Grapes and Wines from Hexi Corridor Region (China): Based on a QuEChERS(-)UHPLC(-)MS/MS Method.[Pubmed:30072592]
Molecules. 2018 Aug 2;23(8). pii: molecules23081926.
The aim of this study is to develop and validate an improved analytical method for the simultaneous quantification of 20 types of mycotoxins in grapes and wines. In this research, the optimization of tandem mass spectrometer (MS/MS) parameter, ultra-high pressure liquid chromatography (UHPLC) separation, and QuEChERS procedure, which includes wine/water ratio, the amount and type of salt, clean-up sorbent, were performed, and the whole separation of mycotoxins was accomplished within 7 min analyzing time. Under optimum conditions, recoveries ranged from 85.6% to 117.8%, while relative standard deviation (RSD) remained between 6.0% and 17.5%. The limit of detection (LOD, 0.06(-)10 mug/L) and the limit of quantification (LOQ, 0.18(-)30 mug/L) were lower than those permitted by legislation in food matrices, which demonstrated the high sensitivity and applicability of this efficient method. Finally, 36 grapes and 42 wine samples from the Hexi Corridor region were analyzed. Penicillic acid (PCA), mycophenolic acid (MPA), cyclopiazonic acid (CPA), fumonisin B1 (FB1) and zearalenone (ZEN) were detected in a small number of grape samples with lower concentrations between 0.10 mug/L and 81.26 mug/L. Meanwhile, ochratoxin A (OTA), Aflatoxin B2 (AFB2), MPA, CPA, and ZEN were detected in some wine counterparts with concentrations ranged from 0.10 mug/L to 4.62 mug/L. However, the concentrations of the detected mycotoxins were much lower than the maximum legal limits set of other products.
A feasibility study of producing a peanut oil matrix candidate reference material and its application to support monitoring of aflatoxins statues for public health purposes.[Pubmed:30064774]
Food Chem. 2018 Dec 1;268:395-401.
The first peanut oil reference materials in naturally contaminated aflatoxins was developed, because of the high consumption of this product and the potential risk associated herewith. Based on liquid chromatographic method, homogeneity, short-term of 60 degrees C for seven days and long-term of 25 degrees C for twelve months' stability studies of candidates were assessed. The obtained data and statistical results showed a successful feasibility study, without any significant trend. Nine selected expert laboratories were invited to certify the contents of candidates using distinguish quantitative liquid chromatographic method. The certified values and expanded uncertainties (k=2) for these two batches were 6.5+/-1.6mug/kg, 29.3+/-5.3mug/kg for aflatoxin B1; 1.2+/-0.3mug/kg, 5.2+/-0.9mug/kg for Aflatoxin B2; 5.0+/-0.4mug/kg, 8.4+/-0.7mug/kg for aflatoxin G1; and 2.1+/-0.2mug/kg, 3.5+/-0.2mug/kg for aflatoxin G2, respectively.
Mycotoxin contamination of sorghum and its contribution to human dietary exposure in four sub-Saharan countries.[Pubmed:29912638]
Food Addit Contam Part A Chem Anal Control Expo Risk Assess. 2018 Jul;35(7):1384-1393.
This research aimed at evaluating the safety, and the type, level and prevalence of mycotoxins in grain sorghum of four sub-Saharan African (SSA) countries (Burkina Faso, Ethiopia, Mali and Sudan). A multi-analyte LC-MS/MS method for quantification of 23 mycotoxins (nivalenol, deoxynivalenol, fusarenon X, neosolaniol, 3-acetyl deoxynivalenol, 15-acetyl deoxynivalenol, diacetoxyscirpenol, roquefortine C, HT-2 toxin, alternariol, T-2 toxin, FB1, FB2, FB3, zearalenone, aflatoxin G1, aflatoxin G2, aflatoxin B1, Aflatoxin B2, sterigmatocystin, OTA, altenuene, alternariol monomethylether) was applied to different sorghum matrices. Of the 1533 analysed samples, 33% were contaminated with at least one of the following mycotoxins: aflatoxins, fumonisins, sterigmatocystin, Alternaria toxins, OTA and zearalenone. Country of origin, colour, source and collection period of sorghum samples significantly influenced the type, level and prevalence of mycotoxins. Sterigmatocystin (15%), fumonisins (17%) and aflatoxins (13%) were the most prevalent. FB1 (274 +/- 585 microg/kg) had the highest mean concentration followed by FB2 (214 +/- 308 microg/kg) while diacetoxyscirpenol (8.12 +/- 19.2 microg/kg) and HT-2 (11.9 +/- 0.00 microg/kg) had the lowest concentrations. Neosolaniol, fusarenon-X, 3-acetyl deoxynivalenol, 15-acetyl deoxynivalenol, T-2 toxin, nivalenol and roquefortine C were not detected in any of the samples. Sudan had the lowest prevalence and mean concentration of all mycotoxins. Pink sorghum had the highest concentrations of fumonisins and aflatoxins. Mycotoxins from Aspergillus spp. and Alternaria spp. are the mycotoxins of concern in SSA grain sorghum with regard to prevalence, concentration and possible health risk from exposure. Based on the performed risk characterisation, daily consumption of sorghum containing aflatoxins, alternariol, alternariol monomethyl ether, sterigmatocystin and OTA could result in exceeding the established health-based guidance values for these toxins.